

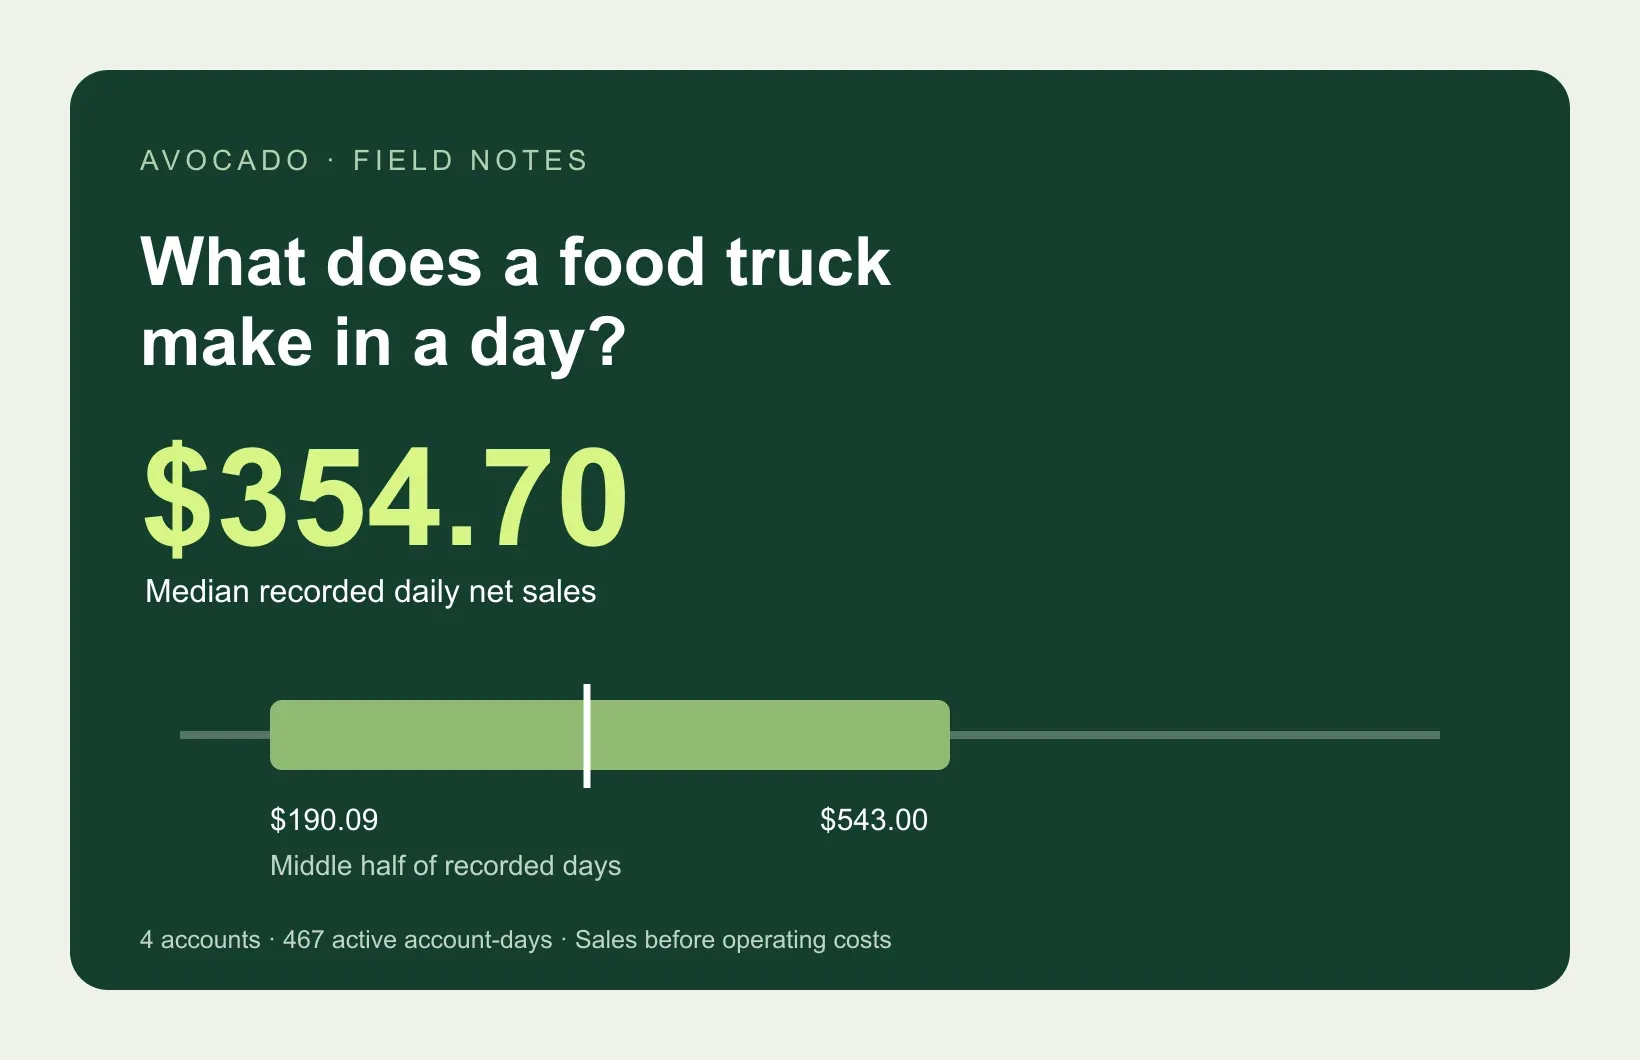
How much does a food truck make in a day? In our small sample of four food-truck and food-trailer accounts, the median recorded day produced $354.70 in net sales. The middle half of days ran from $190.09 to $543.00. Those are sales recorded through Avocado, before operating costs, not an owner's take-home pay.
We analyzed 11,828 paid orders across 467 active account-days in a November 2025–October 2026 study window. The accounts had different starting dates, schedules and customer bases. This is a look at four businesses using our software, not an estimate of what every food truck should earn.
The useful part is the spread. A single daily average hides the quiet shifts you still have to staff and the occasional big day you cannot budget around.
Food truck revenue per day: the observed range
Here is the distribution of net sales across the 467 recorded account-days. A percentile describes where a day falls in that distribution: the 25th percentile means about one-quarter of days were at or below that amount.
| Measure | Net sales per active day |
|---|---|
| 10th percentile | $110.60 |
| 25th percentile | $190.09 |
| Median | $354.70 |
| 75th percentile | $543.00 |
| 90th percentile | $990.80 |
| Mean | $464.65 |
The mean was about $110 higher than the median. Larger sales days pull the mean upward. If you used $464.65 as your expected ordinary day, you would be budgeting above what at least half the observed days actually produced.
There is another way to see it:
| Daily net sales | Recorded days | Share of days |
|---|---|---|
| Below $250 | 164 | 35.1% |
| $250 to below $500 | 161 | 34.5% |
| $500 to below $1,000 | 95 | 20.3% |
| $1,000 or more | 47 | 10.1% |
A $1,000 day happened, but it was roughly one in ten recorded days in this cohort. It should not become a default assumption in a new truck's business plan.
Download the aggregate daily-revenue tables as CSV. The file contains summary statistics, not individual businesses' daily sales.
What counts as a day?
For this study, an active account-day is a local calendar date with at least one qualifying paid order. Two accounts selling on the same date count as two account-days. The four accounts contributed between 62 and 201 active days each; this is not 467 consecutive days of one truck's operation.
We did not have verified historical opening schedules. A date with no order is excluded because we cannot tell whether the truck was closed, made no sales, or used a different payment system. That makes these figures sales per recorded active day, not sales per calendar day or per scheduled shift.
Late-night service also needs care. We grouped orders by local payment date, so a service that crosses midnight can occupy two dates. Your own shift-based report may use a different cutoff.
Orders per day matter as much as the average ticket
The median recorded day contained 17 paid orders. The middle half of days had 9 to 30 orders. Across all qualifying orders, the median pre-refund subtotal was $16; the middle half of order subtotals was $12 to $21.50.
Those are separate distributions. Multiplying the median order count by the median ticket does not reproduce median daily sales. Each day's mix of order sizes is different.
For your own forecast, use a simpler identity:
Daily net sales = qualifying order subtotals − recorded refund subtotals.
Then ask what would change that number: more customers, larger baskets, fewer refunds, another service window, or a different location. Our restaurant add-on analysis explains how to examine basket size without treating a raw spending difference as proof of an upsell's effect.
Revenue is not food truck profit
The $354.70 median is not money left after paying the crew. Net sales here subtract recorded subtotal refunds. They do not subtract ingredients, packaging, payment fees, wages, fuel, commissary rent, event fees, insurance, repairs or financing.
We do not have complete operating-cost records for these accounts, so we cannot calculate their profit margins from this study.
Use your own costs to turn a sales forecast into a break-even target. This example is illustrative, not a result from the four businesses:
| Input | Example assumption |
|---|---|
| Ingredients and packaging | 35% of sales |
| Payment and other variable costs | 5% of sales |
| Contribution left before daily fixed costs | 60% of sales |
| Shift labor and allocated daily overhead | $240 |
| Break-even sales | $240 ÷ 0.60 = $400 |
Under those assumptions, $354.70 in sales would leave $212.82 before the $240 in daily costs, a $27.18 shortfall. That is a worked example, not an estimate of any merchant's loss. Replace every assumption with your own figures, including pay for your time.
For a festival, add the booth fee, travel and extra prep, then compare the result with the regular service you would give up. Our food truck event break-even worksheet walks through that decision.
How to build a daily revenue forecast you can use
Start with comparable services. Separate a weekday lunch, a recurring brewery stop and a ticketed festival. Different hours and customer demand make a single all-service average hard to use.
Record every planned shift. Keep zero-sales shifts and closures in your operating log. Your POS only sees the transactions it processes.
Plan a quiet, typical and busy case. Use your own lower quartile, median and upper quartile from comparable services. The ranges in this article demonstrate the method; they are not targets for your truck.
Check capacity. Forecast orders per hour against what the crew and equipment can actually finish. Attendance is not the same as orders you can serve.
Subtract the whole cost of opening. Include labor, food, fees and travel, then compare contribution with the amount you need to cover overhead and owner pay.
Do not multiply this study's median by 365 to estimate annual revenue. You would be assuming a sale-producing day every day, ignoring closures, onboarding dates and seasonality. Our earlier food truck seasonality study shows why a bigger seasonal total can reflect more participating trucks rather than a better result for the same truck.
How we analyzed the orders
Avocado ran a read-only analysis on November 12, 2026, for the local-date window November 1, 2025 through October 31, 2026. Qualifying activity in the selected cohort began December 22, 2025. The cohort consists of four accounts identified as operating food trucks or food trailers from business names, descriptions and our customer records. Separate event and catering accounts and a farmers-market stall account were excluded.
We included orders marked paid, with a payment timestamp, a positive subtotal and a non-canceled order status; gift-card purchase orders are excluded. Daily net sales are order subtotals less all recorded refund subtotals attached to those orders as of the extraction date. Subtotals exclude separately recorded tax, tips, processing fees and delivery fees. We group by the merchant's configured local timezone and payment date.
The 11,828 orders generated $216,991.49 in net sales across 467 active account-days. Daily percentiles pool those account-days, so an account with more days contributes more observations. As a sensitivity check, giving each account equal weight by taking the median of its median daily sales gives $422.81 instead of $354.70. That difference is one reason we do not present the pooled median as a typical result for every business.
The sample is small, selected rather than random, and covers only activity recorded through Avocado. We do not observe all revenue streams, opening hours, weather, cuisine differences or complete operating costs. Refunds are attributed back to the original order's payment date; future adjustments can change historical net sales. These observations do not establish national earnings, profits or the cause of differences between days.
Use the range to ask better questions
The lesson from these four accounts is that an ordinary day and a good day can be far apart. Before accepting a location or adding a shift, estimate how many orders you can serve, what those baskets are worth, and what it costs to open.
Avocado for food trucks keeps orders and sales in the same system so you can review your own operating history. Start with your own comparable days, then use the numbers to decide where the truck should be next.